December 8, 2021

What's an Outlier/Anomaly?
In it's simplest form, an outlier/anomaly is an observation that appears to deviate markedly from other observations in the sample.
Not sure what this means? Let's use an example. Say you've got a Disney + account. Let's say you like 'The Little Mermaid'.
And let's say you *really* like it, so much that you play it everyday of the year. Everyone else however might watch it 2 to 3 times in a given year.
For the Disney + Data Analyst who's viewing the frequency of unique individuals watching the Lilttle Mermaid 🧜♀️; you would be an Outlier as you have deviated significantly from the norm.
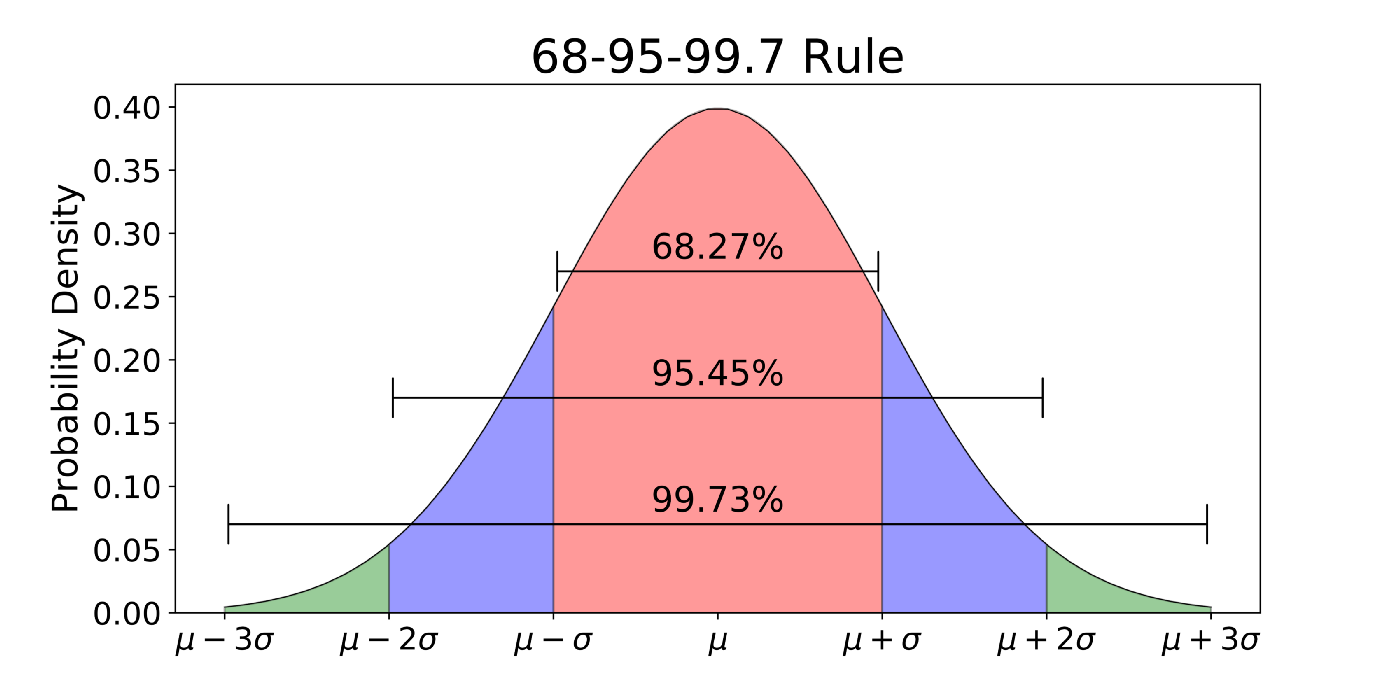
Now the degree of deviation and the method with which this is observed is debatable based off the technique you utilise, but in this article, we'll use the 68 - 95 - 99.7 rule that assumes the distribution follows a Normal ( Gaussian ) Distribution.
The 68- 95 - 99.7 rule assumes that for any given normal distribution, the following should hold true:
No; in short, context is what determines whether an Outlier is bad or not. Outliers are simply points that deviate away from the norm; this doesn't mean that the point isn't valid or warranted.
Let's refresh ourselves and use our disney example. Imagine that Disney + is running a marketing campaign where for a one week duration, there is a 50% reduction in the Annual Subscription price.
This would likely result in a large increase in the number of individuals who would sign up, compared to usual.
If the marketing analyst is to compare sign-ups from all time and then look at this period, it would very likely look like sign-ups over the promotion period are abnormally high, or in other words, they are an anomaly/outlier.
So, is this bad? 🤷 Nope. Within the context we're considering this is very much explainable.
On the other hand, we could have a situation where Outliers are not ideal as they skew the distribution in an unintended manner.
Say for example, we're an Internet Service Provider and we want to have a better understanding of the average internet speeds people are getting in a neighbourhood.
Say that the Monthly Average reveals it is 15MB/S, where as our advertised service is 25MB/S. Looking into the data, we identify a 24 hour period where there were periods where there was strong signal intereference in our network zone which impacted out overall results significantly, dropping speeds to 5MB/S.
In that case, those Outliers impact our average in a way that is not representative of what our actual speeds should be; hence including these anomalous data points isn't ideal.
Should we simply remove Outliers if they're one-off events?
Most definitely not. As you've seen in the above two examples; both have cases where Outliers exist, but only the latter cause should have the Outliers removed for the purpose of the network speed analysis.
If the question is about overall network durability in the face of unintended interference, then the Outlier is a valuable series of data points that should be included as they highlight the impact of network degradation.
The only scenario where Outlier removal is valid would be:
Other than this, we shouldn't seem to remove anomalous data points.
So, how can we identify Outliers?
For the majority of datasets you'll analyse (Unless transformed by the Central Limit Theorem) , they won't follow a standard normal distribution.
In this case, what techniques can we use to simply identify Outliers/Anomalies?
The Interquartile Range Method
This might ring a bell for some of you but the simple approach for this is denoted below:
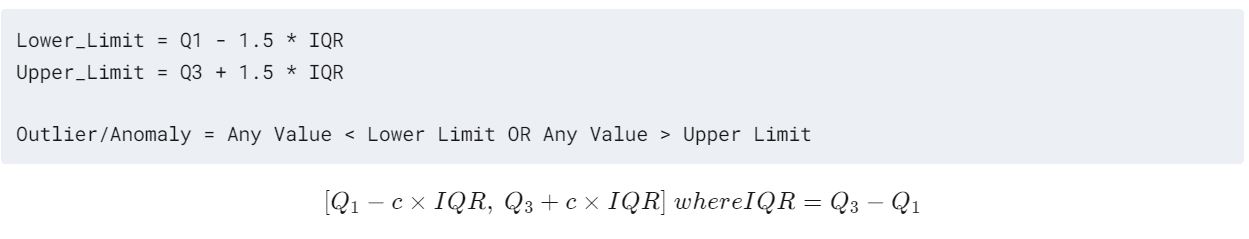
Now for those of you that are curious, you might seek to ask:
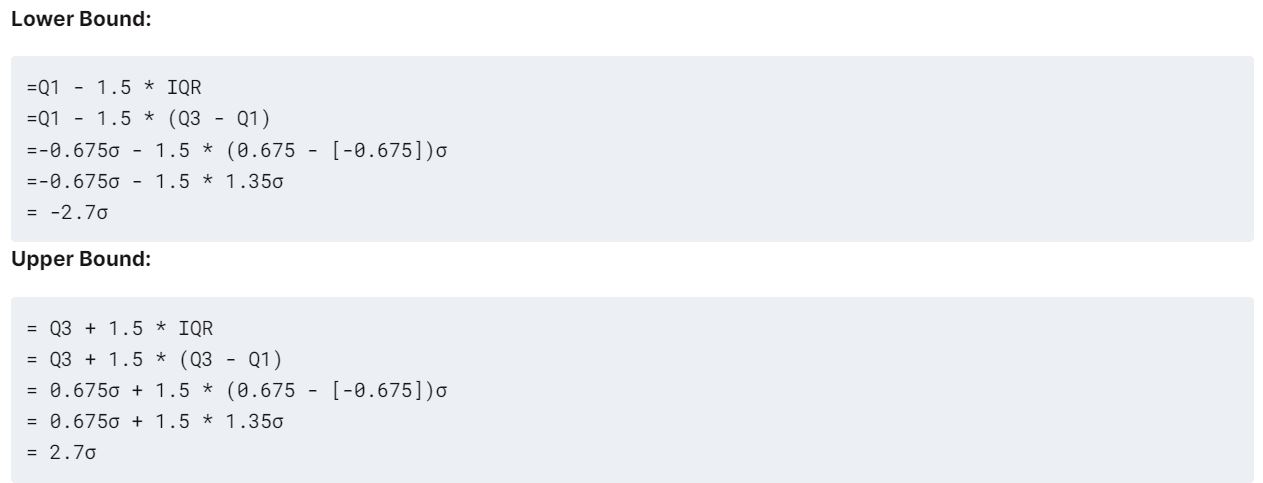
Why 1.5x the IQR?
1.5x is the inflection point at which we are +- 3 Standard Deviations away from the population mean as per our anomaly definition we highlighted earlier.
Don't believe me? Well, we can take a look with some simple mathematics below that denotes the upper and lower bounds.
Now that you've understood the theory of how to identify anomalies using the Interquartile Range Method, take a look at this link here where we showcase how you use the ADTK library to proactively identify anomalous events!
Remember, practice makes perfect!
We've covered a number of concepts in our article so let's do a quick recap over what you've now learnt:
Happy learning and keep on Track! 🚀🚀🚀