February 15, 2022

You’ve applied for multiple data analyst roles where you’re growing impatient from hearing back when suddenly;
“You’ve got mail.”
It’s from one of the companies you’ve applied for.
“Thank you for applying. We’ve included a Technical Aptitude Test to check your proficiencies with a take home interview challenge. We'd like you to return back to us…”
You get a sinking feeling in your stomach as you realize you have no idea how to approach this…
Take-home interview challenges are becoming a standard measure to gauge candidate proficiency for data professionals. These fall into two broad buckets where you can take a standardized hacker rank test as well as a take-home case study challenge that can take a multitude of hours. This is a lengthy process at best, but in this article, we'll break down some of the common pitfalls you'll need to watch out for. Let’s help you conquer this.
With hundreds of applicants per job, there needs to be a simple way to assess a candidate's performance. Welcome to the Take Home Challenge. Take-home challenges are used by recruiters to judge candidates' practical programming skills in a standardized and repeatable format. As a Data Analyst, you aren’t just graded on your technical competencies but also the story you present back to the hiring manager.
So how do you approach such an assignment when things aren’t clear?
We start with logically breaking down the problem into bite-sized chunks our audience can handle.
Let’s get started.
Depending on the take-home challenge you’ll either get a set of questions to answer or an open-ended question that is ambiguous enough to tackle how you structure your approach to problem solving in a data analytics context. It’s important to understand that teams value individuals who are able to think on their feet and push forward with the direction towards analytics without receiving explicit guidance. Candidates who demonstrate this problem solving aptitude always end up with more negotiation and salaries as they stand out.
So, how do you approach this? This depends on the company you’re applying for but we’ve included a few of the tips you should keep in mind as you start your analysis:
· Specify your assumptions - if you’re uncertain about some data, send an email to the recruiter for clarification. Always ask questions and seek to back up any assumptions you may bake into your analysis. This is a critically important part to ensure that your assumptions can be tested and understood
· Network - Researching about the team and its members on LinkedIn is a valid strategy. Being the largest professional networking site, it is a great opportunity to understand the interview process from individuals who have already gone through this process
· Business Strategy - Connect the dots between the problem you’re solving and how it might tie into the company's overall strategy. Are you able to showcase how this analysis might hypothetically help the company of interest? This helps demonstrate your analytical aptitudes while highlighting your financial analysis competencies
Once you’ve understood the problem and stated your assumptions, it’s time to build out how the data is connected. You’ll generally receive the data in a CSV spread over multiple tabs or in a Cloud Warehouse that you can access and extract the data from.
On the basis you need to extract the data yourself, it’s important you understand how the data is structured, otherwise, you won’t know how to build a query to merge all the data tables you need for your analysis.
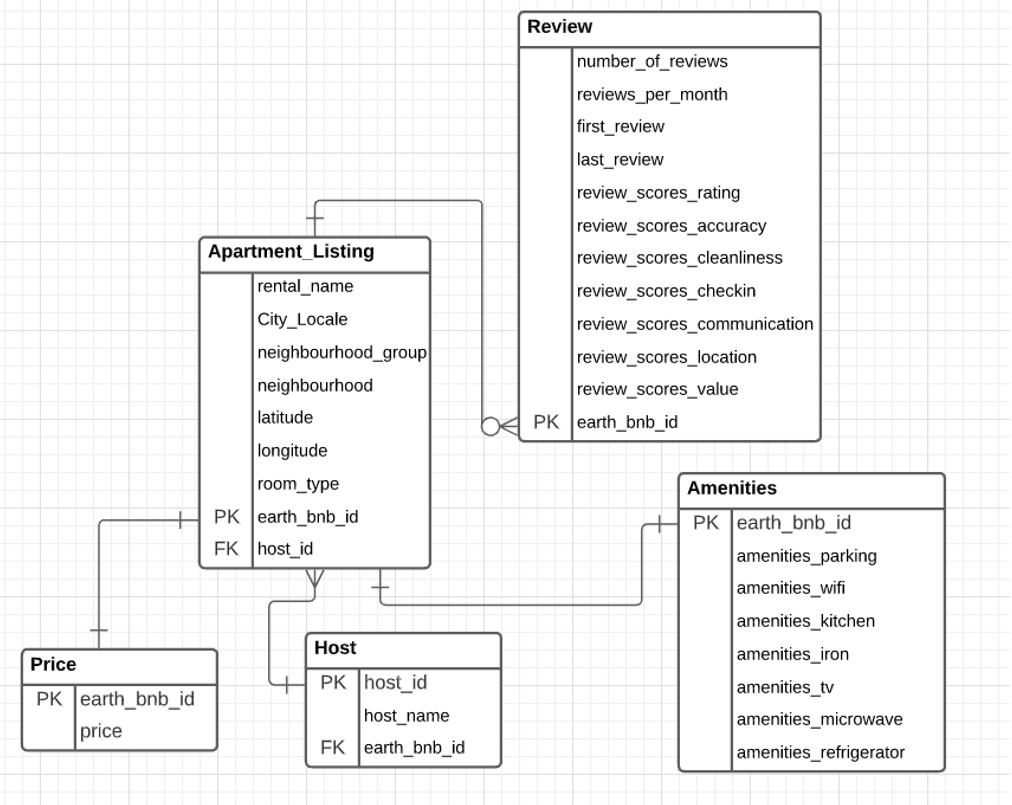
This brings us to the concept of data modeling which is a visual heuristic used to help structure and showcase the relationships between different datasets. We would recommend including a Data Model in your analysis to showcase to the audience how you’ve structured your approach to connecting the data needed for your analysis.
Provided your Hiring Manager has a Data Engineering Background or similar, they’ll appreciate how you’ve sought to create a logical schema to organize the data where you might earn a few points, demonstrating this proactively.
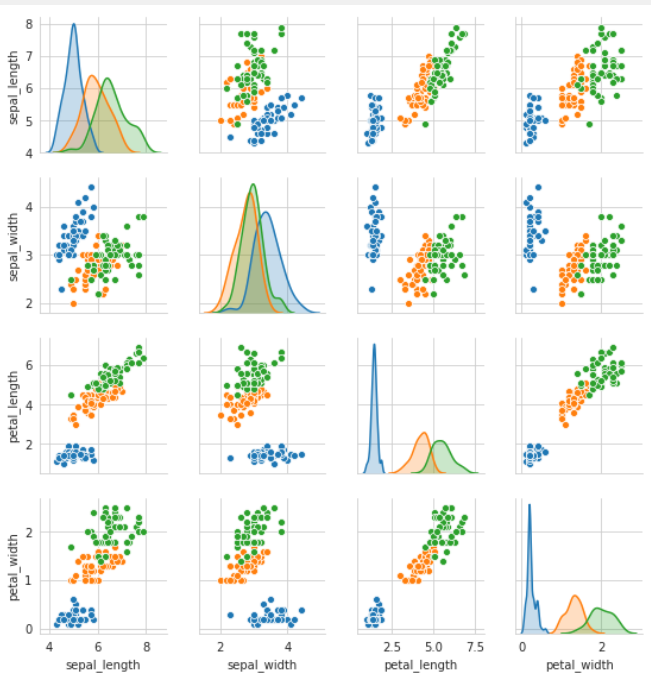
Now that you’ve framed up your data in a data model - it’s time for the exploratory data analysis, known as EDA, for short. EDA is about exploring the data through a combination of both descriptive and inferential statistics to identify trends, relations, and anomalies in the data. Having built up a structured series of questions to address from your earlier framing of the analysis will help prevent you getting stuck into the dreaded paralysis by analysis phrase which is very common. Additionally beyond this, having a structured approach to exploring your data through a systematic manner of descriptive visuals, before traversing to inferential visuals, creates a clear hierarchy in your analysis.
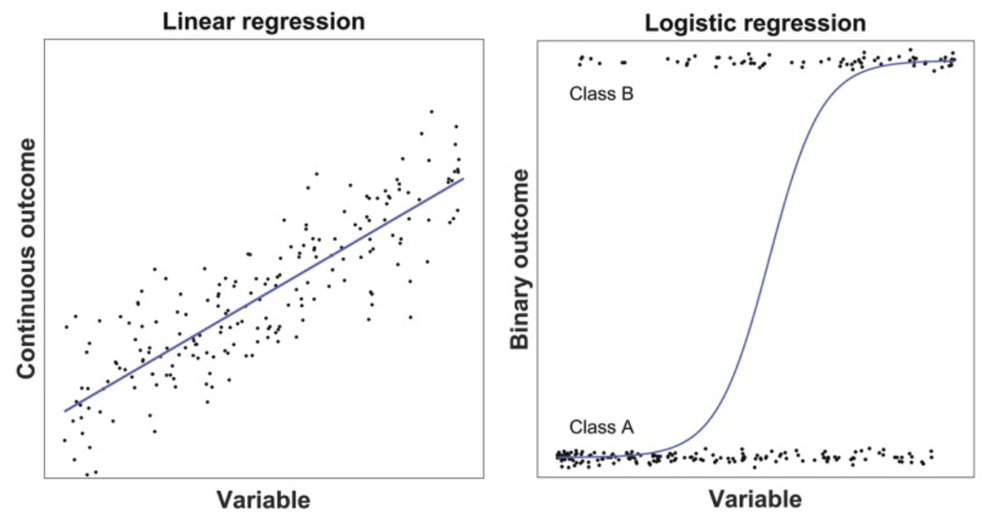
Provided you’ve completed the exploratory data analysis phase, you’ll be moving to the Analytical Modeling phase of the case study. Not all case studies have a component where you need to create a linear regression model, but in the case where you need to perform forecasting or classification tasks, it’s important you understand how to proceed accordingly.
This section will combine your previous insights from your exploratory analysis where you’ll then seek to use a combination of predictor variables to help create a solid model fit. Please note that recruiters may often watch out for additional techniques such as Recursive Feature Elimination (RFE) as well as how you’ve applied the overall interpretation of a classification model such as Logistic Regression.
Linear and Logistic regression are commonly tested, and I would advise to get a solid grip across the sklearn library of Python so you can better interpret what the model coefficients mean and how you might express concepts such as the log-likelihood to your recruiters. This question tends to be asked more in advanced analyst / data scientist roles and is less common for Data Analyst roles. Additionally, you might find the datasets on Kaggle very handy – look at the list of regression techniques and their respective datasets on Kaggle.
Lastly, you’re at the most important part of the take home assignment. The presentation lens. Whilst you might have a very solid technical analysis, if you’re unable to finesse this into a logical story the audience can follow, you’re likely going to lose points against a candidate with a less technical analysis, but more polished story.
But why? You might think that getting a high model fit is all that matters. And you’re right, to an extent. Companies don’t make decisions based on high model scores. They make decisions based on the best available data and the most compelling narrative that can be adopted and understood by the business.
Storytelling is one of the most important parts of the interview challenge as it tests your ability to tell a compelling narrative to an audience. skills through the lens of visualization. It has the power to show the hiring manager that you don’t just understand what you’ve done but also have compelling evidence to support your solution in a way any stakeholder can understand.
Wrapping up, technical take-home interviews can be nerve wracking. This is especially the case if you don’t understand the terminologies or expectations that can be thrust upon you. Here’s a recap of the key things you’ll need to watch out for:
· Scope your issues from the Take Home Assessment Dataset
· Create your own Views from a Data Warehouse (Basic ETL)
· Demonstrate data cleansing competencies (Python | Power Query | Excel )
· Demonstrate data viz. competencies (Python | Power BI | Tableau | )
· Presentation of respective insights to business stakeholders in a compelling narrative (Executive, Technical, Non Technical)
So, where can one learn all of this and more? Whether you’re looking to be a business analyst, visual specialist, business intelligence analyst or data analyst, Tracked has the analytics program for you. You’ll need to master the core fundamentals of problem solving augmented by technical workflows, so why not learn the best practices from Guides at Fortune-500 Corporations like Atlassian, AirWallex and Canva? Digital is rapidly changing and with it, the analytical landscape needs more and more talented data professionals. The Tracked Accelerated Program doesn’t just emphasize the importance of the technical workflows but does away with learning individual technologies in isolation through it’s cloud-based learning platform that seamlessly joins these technologies together.
Tracked’s expert curriculum was founded on the premise of affordability and hireable outcomes, developed with experts from Microsoft, Salesforce and Harvard to name but a few contributors who sought to create an end-to-end analytics pipeline reflective of industry.
The program’s 450+ hour curriculum covers:
· Data Modeling
· Data Cleansing & Preparation
· Analytical Foundations as a Data Analyst
· Extract, Transform and Load as a Data Analyst (Data Warehousing)
· Insight to Value as a Data Analyst
· Recruitment Portfolio Project (Cloud Based Workflows)
· Data Analytics Exam
Alongside mastery of the core technical workflows required for business analysts, visual specialists, business intelligence analysts and data analysts; you won’t learn alone.
If you’re interested in a career in data, consider the Tracked Accelerated or Comprehensive Analytics Career Track today. They’ll get YOU on Track for an exciting career in data.